GLOBAL CHANGE
GLOBAL CHANGE
Here, as part of New England Oceanographic Lab’s goals of providing publicly available scientific articles and information, we have collected a series of assessments, reports, and policies in downloadable form for the viewers.
IPCC Reports
As part of the U.N.’s efforts to negotiate a world-wide strategy to reduce or ameliorate climate change, the Intergovernmental Panel for Climate Change (IPCC) has issued many reports on the upcoming global impacts. We have provided downloadable copies of some of these under the IPCC tab.
MAINE
The State of Maine has initiated several environmentally helpful policies and has activated a long-term plan to turn Maine carbon-neutral. Without considering the politics of the new policies, these State actions may be judged in part based on how they fit into the climatic change predictions presented by the IPCC. We offer downloadable copies of these goals and policies under the Maine tab.
The basis of Climate change
A summary by J. P. Christensen.
The climate change problem may be reduced to a simple statement: Human activities have so altered the planet’s surface that the changes cause the planet to warm. Warming comes about because of several linked processes. Incoming light from the sun warms the planet, but the planet also radiates infrared and visible light back out into space. This loss of energy to space somewhat cools the planet. As of the beginning of the industrial revolution in the 1700’s, land altering human activity increasingly changed the surface of earth with the result that greenhouse gases were increasingly released into the atmosphere. These gases absorb part of the light going back out into space, and the gas molecules themselves become warmer, heating both the air and the planet surface. The primary greenhouse gas, carbon dioxide, CO2, has a natural cycle in which it is taken up at times and in places by the vegetation and planet’s surface and is released to the air in other times and places. Human activity altered the balance through several activities. Mining and burning fossil fuels releases massive amounts of CO2 to the air. Concrete production and its use in construction also releases CO2. Deforestation and subsequent agriculture replaces carbon rich ecosystems for low-biomass crops. Land clearing and building of infrastructure, towns, and cities act to remove these areas from the natural biosphere.
measuring the air:
The Mauna Loa Observatory
If these activities were of small scale, the resulting human-caused CO2 release would be small relative to the natural cycles, and any change in atmospheric temperature due to human activities would be undetectable relative to the natural variability. But in the late 1950’s and 1960’s, scientists began to wonder if our global population was large enough to change the atmospheric composition. The first highly precise long-term monitoring of the atmosphere began in about 1958 at the Mauna Loa Observatory in Hawaii (see Figure 1). That monitoring program continues today and is the longest running record of the air’s CO2 concentration.
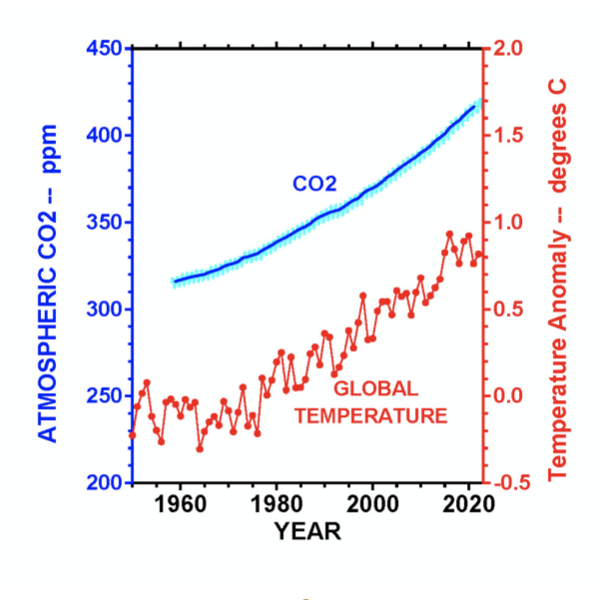
Figure 1. Atmospheric CO2 concentrations and global average temperature anomaly versus calendar year from 1950 through 2022. Atmospheric concentrations of CO2 were measured at the Mauna Loa Observatory. Monthly average values are the wavy line in light blue. Annual average values are the smoother dark blue line. Data sets are from the websites, https://gml.climate.gov/webdata/ccgg/trends/data.html, and https://ourworldindata.org/co2-and-other greenhouse-gas emissions.
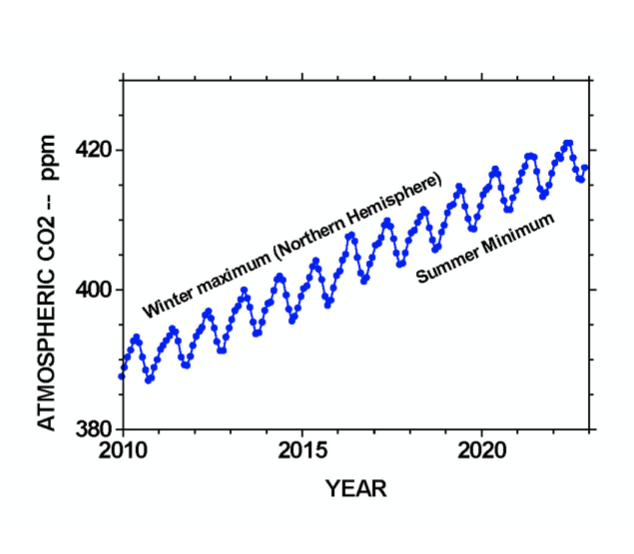
Figure 2. The atmospheric CO2 concentration in an expanded graph for the years 2010-2022. Seasonal variations correspond with growth of vegetation and the biosphere in summer and demise of vegetation in winter. The general upward trend of the data is taken as a measure of climate change and is now accepted as human caused.
The Mauna Loa record demonstrates 2 things. (1) A wavy pattern is seen in the measurements (the light blue line). When the graph is expanded (see Figure 2), repeated cycling between winter and summer can be seen. Vegetation growth in summer removes part of the CO2 from the air, while reduction in vegetation and its hibernation in winter releases part of the CO2 back to the air. (2) The amount of CO2 in the air has been continually increasing. In 1959, the annual average from the Mauna Loa record was about 316 parts per million. (One part per million means that there is 1 molecule of CO2 per million molecules of all gases within the air. This concentration is calculated for dry air.) As of 2021, concentrations reached greater than 416 ppm. Atmospheric monitoring stations are now established around the globe and are operated by many governments and academic institutions. The newer data verify the trends seen in the Mauna Loa data.
Given scientific concern about possible climate change, the United States (via the National Oceanic and Atmospheric Administration, NOAA, and the National Aeronautics and Space Administration, NASA) and other governments increased their global climate monitoring. Also, a process was developed for estimating the annual average global surface temperature, here represented in Figure 1 by the temperature anomaly, which is the difference between the temperature at any given date and the average for 1961-1990. Within this temperature anomaly graph, the variations between nearby data points appear particularly “jumpy” and may be due to several factors. Although thousands of measurements are currently being made around the globe, the existing coverage may be insufficient to determine the “real” average temperature. Secondly, the various parts of the planet’s surface (oceans, biosphere, glaciers, rocks, soils, etc.) may store heat to different degrees and may release any stored heat in ways that are not well known or are not included in the process of global temperature evaluation. Prior to the 1990’s, the variations in global average temperature (Figure 1) were sufficiently large so that unusual planetary warming could not be statistically demonstrated. At that time, there was considerable uncertainty and argument about whether greenhouse warming was actually occurring. Since that time, the global surface temperature has dramatically increased, and the IPCC has concluded that human activities are primarily the cause (see below).
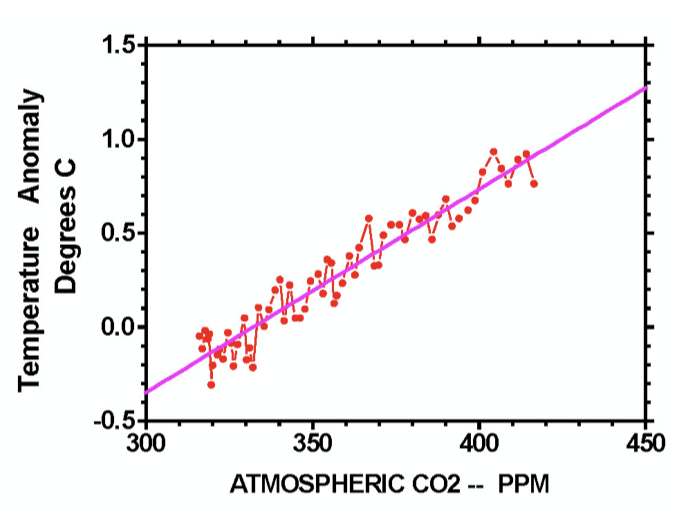
Figure 3. The relationship between global temperature anomaly and the global averaged CO2 concentrations. The red dots and lines are the data shown in Figure 1. The pink line is the linear regression of the data, which shows the upward trend in both.
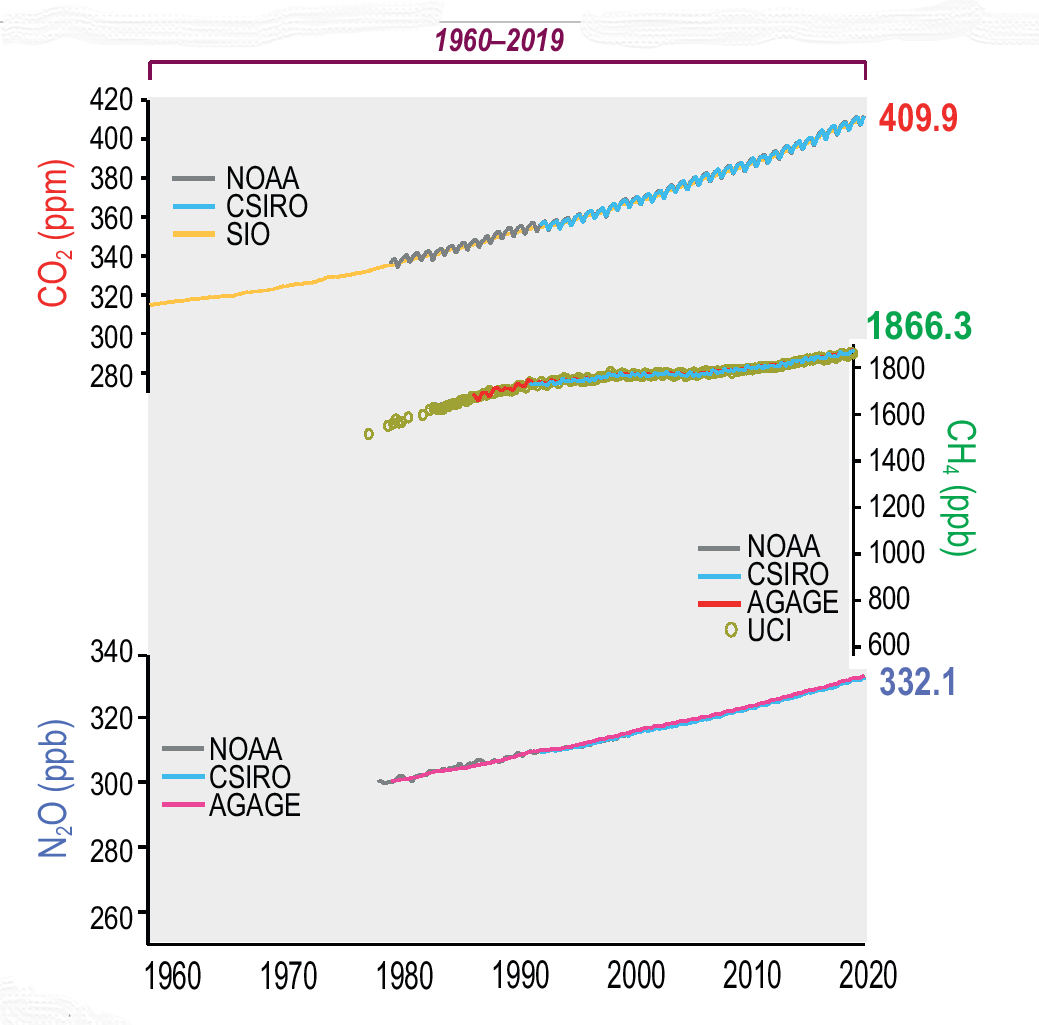
Figure 4. Increases in atmospheric concentrations of carbon dioxide, methane (CH4), and nitrous oxide (N2O) over the last 60+ years, as measured by several different monitoring networks. Figure from the IPCC report, AR6-WGII-Technical Summary, page 68, Figure TS9(c).
In Figure 1, both atmospheric CO2 concentrations and the global temperature anomaly appear to be increasing in similar manner. The data in Figure 1 were re-graphed by plotting the temperature anomaly versus the annual average CO2 concentration, and a close linear association is seen (Figure 3). The theory of greenhouse warming says that increased atmospheric CO2 causes increased atmospheric and surface warming, and Figure 3 demonstrates this. But CO2 is not the sole greenhouse gas. Two important additional gases, nitrous oxide (N2O) and methane (CH4) are both increasing, primarily as a result of human activity, and are both helping to drive the global warming (Figure 4). Each of these has sources different from CO2. Also, each absorbs more light per molecule than does CO2, and they have different residence times in the atmosphere. As a result, these gases add to the warming that caused by CO2. In addition, some consequences of climate change may themselves amplify or constrain the rate of change. For example, atmospheric warming will reduce the amount of global ice (wintertime snowfall extent and duration, area and volume of mountain glaciers, the area of wintertime polar sea-ice, and the area and volume of the major glaciers in Antarctica and Greenland). As the area of snow and ice cover decreases, more sunlight will be absorbed by the earth surface which will increase the global warming rate. As a result, global warming, as seen in Figure 1, has multiple “causes” and linkages. Much of the current scientific effort, as well as the IPCC reports, attempts to untangle the various drivers of climate change. Nevertheless, the result is clear. The planet surface is warming and multiple destructive processes result, as described in the IPCC reports.
Note that recently, several scientists experienced in different aspects of climate change have indicated that the changes they are monitoring appear to be occurring faster than accepted in the IPCC reports. The IPCC attempted to delineate the current rates of change, but these current projections may perhaps represent minimum or “conservative” estimates. If these scientists are right, the planet may change more quickly than expected and the earth may show us much more about the greenhouse process and its linkages than we currently appreciate. [summary end]
Key IPCC 2021 Findings:
Some of the key findings of the IPCC 2021 AR6 Working Group 1 (Summary for Policymakers) are summarized here. The numbering indicates the paragraph numbers given in that report.
A1. “It is unequivocal that human influence has warmed the atmosphere, ocean, and land.”
A2. “The scale of recent change across the climate system as a whole – and the present state of many aspects of the climate system – are unprecedented over many centuries to many thousands of years.”
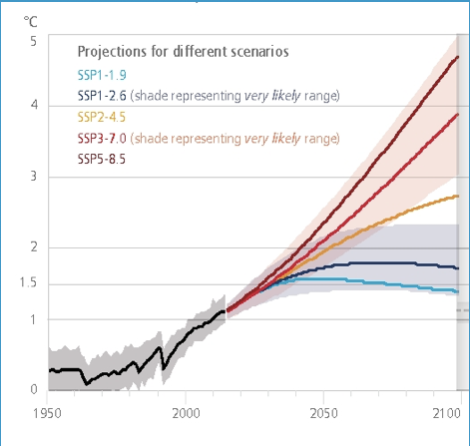
B1. “Global surface temperature will continue to increase until at least mid-century under all emission scenarios considered. Global warming of between 1.5 and 2 degrees C will be exceeded during the 21st century unless deep reductions in CO2 and other greenhouse gas emissions occur in the coming decades.”
B2. “Many changes in the climate system become larger in direct relation to increasing global warming. They include increases in the frequency and intensity of hot extremes, marine heatwaves, heavy precipitation, and in some regions, agricultural and ecological droughts; and increase in the proportion of intense tropical cyclones; and reductions in Arctic sea ice, snow cover and permafrost.”
B5. “Many changes due to past and future greenhouse gas emissions are irreversible for centuries to millennia, especially changes in the ocean, ice sheets, and global sea level.”
C3. “Low-likelihood outcomes, such as ice-sheet collapse, abrupt ocean circulation changes, some compound extreme events, and warming substantially larger than the assessed very likely range of future warming, cannot be ruled out and are part of risk assessment.”